andyjm said:Ok, just so I have got this right, you ran 20 sweeps for each cable, and performed an arithmetic average of the 20 sweeps to come up with the 'average sweep'. You then compared the 'average sweep' of each cable with each of the other cables, producing a difference graph.
Two things have happened, please bear with me.
Info presented in this thread wasn't from averages. I've not compared measurements. I produced a difference graph by overlaying measurement 1 vs other measuremnt. I've done it repeatedly until I could happily conclude that they are repeatable and average is representable. This was done manually for the data I've shared.
Around midnight that day I've produce averages for each cable. These were averages of difference graphs. They don't look too dissimilar to what was posted. When comparing these graphs results were very similar.
REW is very difficult to work with when you deal with 40 measurements per window (thata's 20 measurements and 19 difference graphs) Particularly as it only allows 30 to be opened at a time.
andyjm said:If so, I stand by my earlier comments, the spiky + -1 dB difference plots don't look real. I don't know what artifact is causing this, but it is extremely unlikely that changing the LCR parameters of the cable would lead to that sort of difference. As I posted earlier, (understanding that you didn't use LF yourself), cable effects are LF slope, HF slope and possibly a hump or dip in midrange. To all intents and purposes, your cables are identical apart from this 'noise'.
I'm not trying to convince you. I'm happy for you to dismiss it completetly. I've presented my findings. I've posted asking for advice before doing of what's the best way to do it acoutically. There was no objections on either forum (also posted on the Wam). It's done. I have data which I analysed.
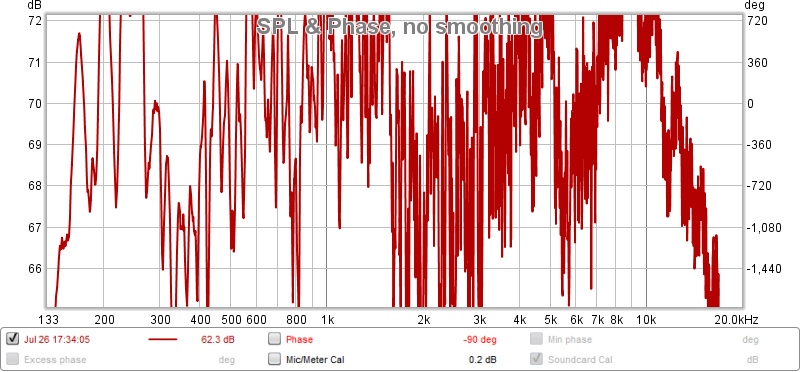
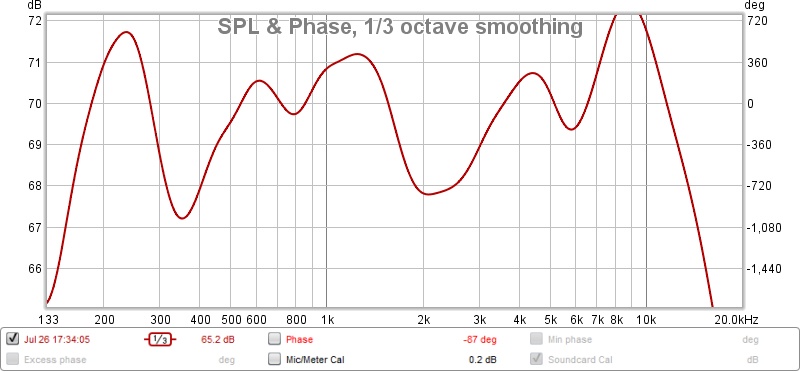
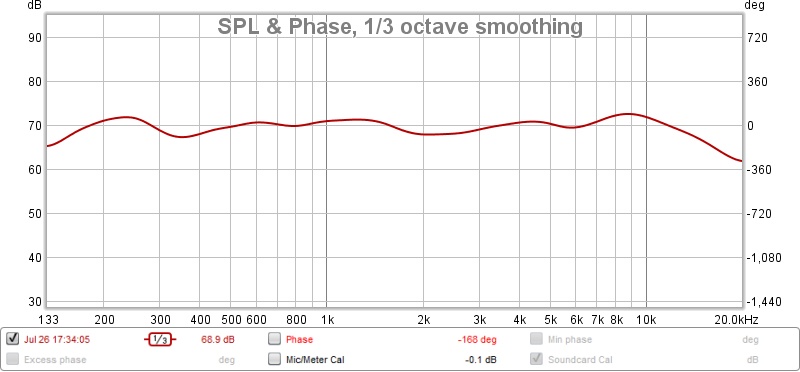
As to spikes you're referring to. Once more this is how every measurement look. What is usually presented is the smoothed version which applies averages. I see an issue with averaging averages. Don't you?
Depending on the smoothing, which usually is applied to read the plots with more ease, you will see 1dB 0.1dB or few dB differences. I'll post some graphs to present this.
andyjm said:If you have the time, you could start the whole process from scratch and see if the difference graphs are similar.
My mates was so excited that I was willing to talk cables that he borrowed the lot (bar one I'm using). If I do it again, it won't be for a while. I'm not a zealot if you don't believe my findings that's fine by me.
andyjm said:Didi you move around the room when you were doing these tests, or did you always stand in the same spot?
Mic was about 0.5m from speakers. I was not directly in the way and neither of 60 measurements was affected by this as IR is clear.


