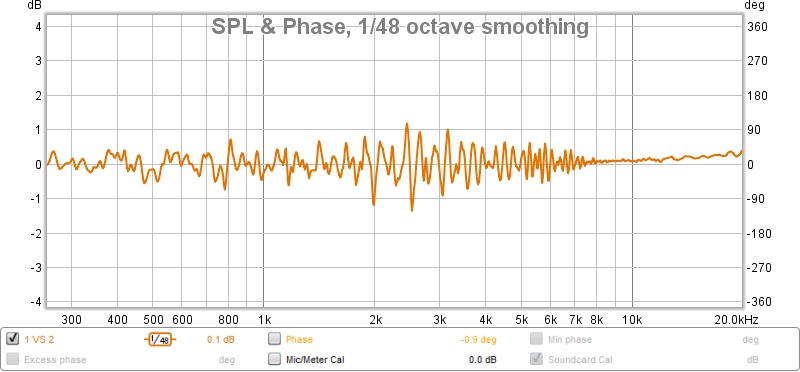
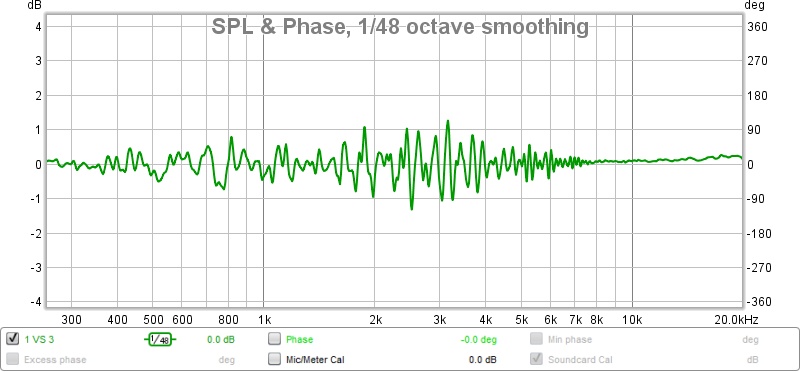
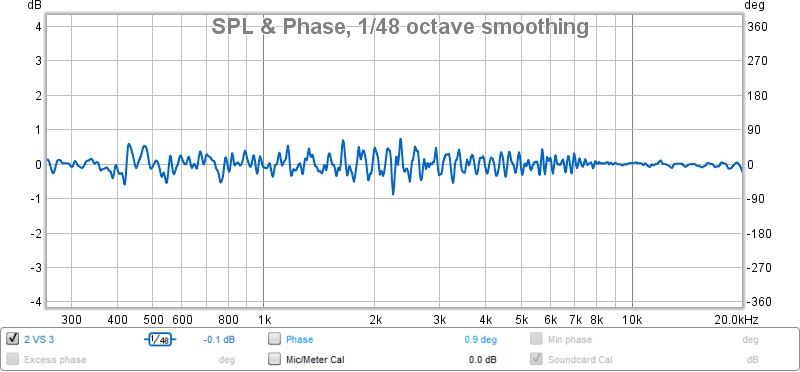
I can measurably show there is a differences between speaker cables

Page 2 - Seeking answers? Join the What HiFi community: the world's leading independent guide to buying and owning hi-fi and home entertainment products.

insider9

Well-known member
Blacksabbath25 said:
If speaker company’s can prove what they claim I would spend more money on cables but can’t see this ever happening so I keep on the fence as it’s just to risky spending lots of money on expensive cable that may give a better sound or may not .

This is what bothers me. Unsubstantiated and exaggarated claims. Makes it hard for us to make an informed decision.
 

Vladimir

New member
Dec 26, 2013
220
7
0
Visit site
insider9 said:
Vladimir said:
I think you got it right already. Measure FR at listening position for the objectivist. Post your percieved listening differences for the subjectivist. Those on the fence will appreciate reading both. Let people decide which information to draw greater value from.

Which one of these 3 are you?

I'm an objectivist when I listen, subjectivist when I measure and on the fence when buying. Does this answer your question? ;)

I believe you are not taking this cable thread seriously, sir.
 
Vladimir said:
insider9 said:
Vladimir said:
I think you got it right already. Measure FR at listening position for the objectivist. Post your percieved listening differences for the subjectivist. Those on the fence will appreciate reading both. Let people decide which information to draw greater value from.

Which one of these 3 are you?

I'm an objectivist when I listen, subjectivist when I measure and on the fence when buying. Does this answer your question? ;)

I believe you are not taking this cable thread seriously, sir.
I’m impressed that Wham ever got onto SACD! (And I do own one of their LPs; I’m not a complete Luddite!)
 

insider9

Well-known member
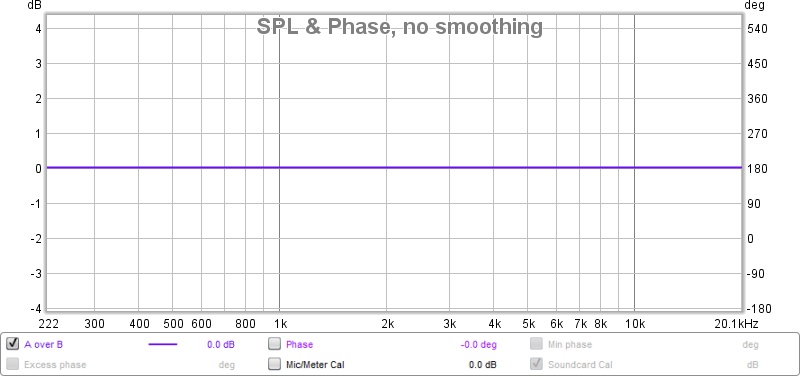
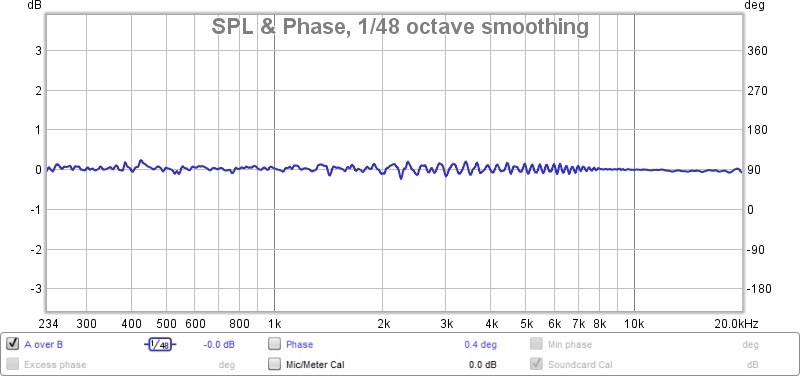
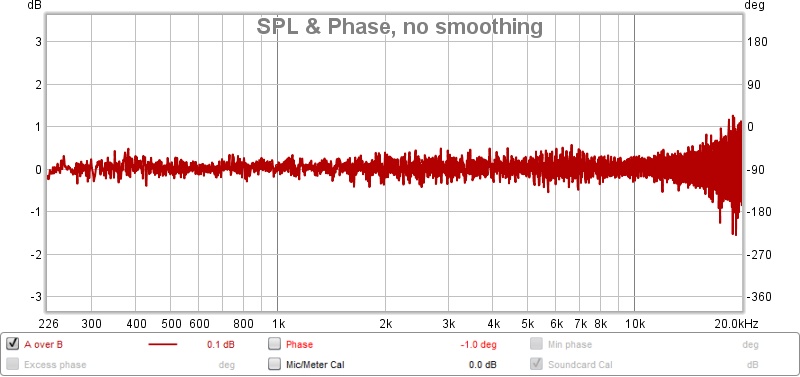
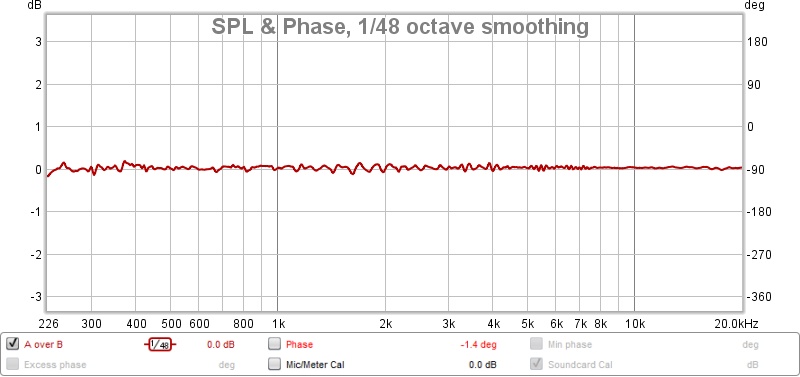
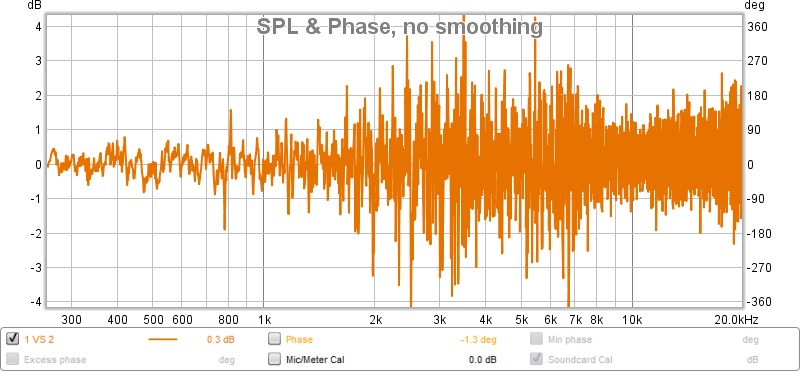
Mic was placed on a tripod as usual. In a random position at half or so meter from speaker (same for all measurements) and the graphs below are showing differences between measurement. To get that in REW you need to go to All SPL tab, in Controls Trace Arithmetic, select measurement A and B and do A/B which will show you the difference.

This is what shows when you overlay the same reading twice.

42753911595_76c2fb5e46_o.jpg


Since all the data is the same it's showing flat line. No difference.

Continued...
 

Vladimir

New member
Dec 26, 2013
220
7
0
Visit site
Is it posible to play instrument or music recording short samples and compare?

Example: 3s Cymbals splash - Cable 1 vs 2. FR overlay, deducted to show differences.
 

Vladimir

New member
Dec 26, 2013
220
7
0
Visit site
I hope your efforts will be appreciated, but do prepare for comments à la "ears are superior to microphones therefore it's all a pointless exercise".
 

insider9

Well-known member
I shared this as I always wondered if it's possibly and what's the best way to do it. My previous attempts were flawed.

I understand there may be criticism. One of the reasons why I've looked for input on methodology. If someone can present a better way and show their work I'd be thrilled.

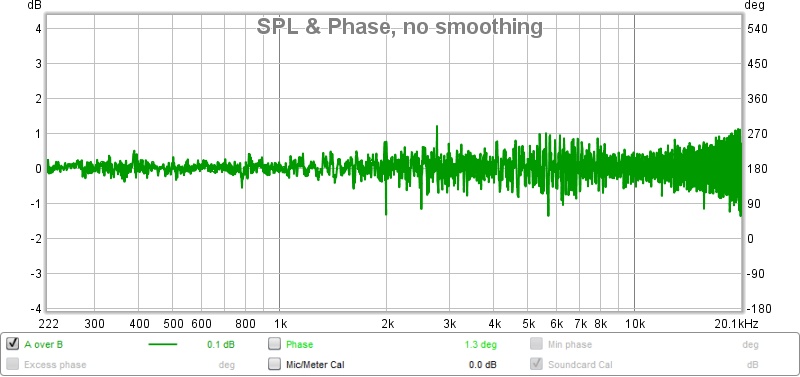
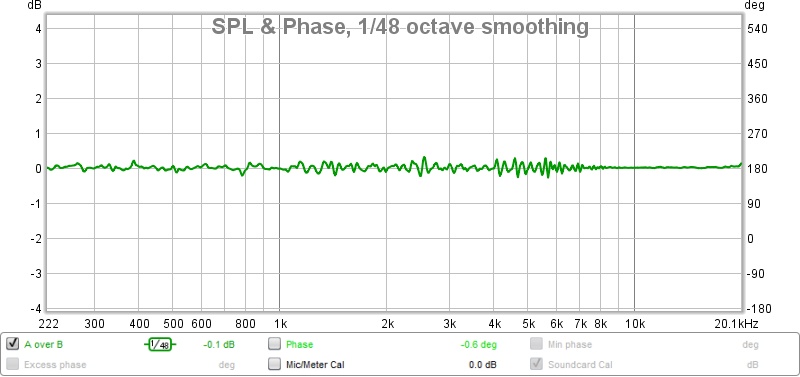
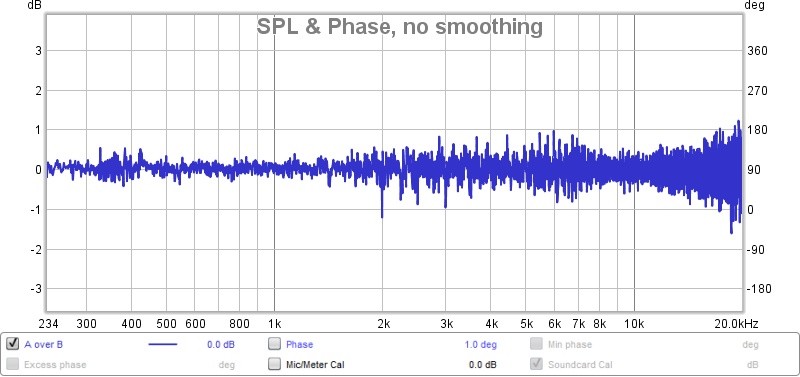
Above measurements show differences exist. Not just that but that different cables measure better/worse at certain frequencies. This goes some way to explain why people can describe cable traits.

If ears are superior to microphone they will pick up on more even differences.
 
So I conclude that 2 and 3 are nearer to each other then either is to 1. Essentially 2 and 3 are within a dB of each other. With no trends I can detect, by which I mean no slopes or bulges. Just wiggles which might be within the realms of noise?
 
Insider, how do we read the Phase scale at the right hand end of the individual graphs? One seems centred around 180, the other two on 90. Is that relevant?

I think I’m ok with the amplitude vs frequency ones as that’s more familiar.
 

insider9

Well-known member
nopiano said:
So I conclude that 2 and 3 are nearer to each other then either is to 1. Essentially 2 and 3 are within a dB of each other. With no trends I can detect, by which I mean no slopes or bulges. Just wiggles which might be within the realms of noise?

Indeed, differences 2 vs 3 are smaller than any comparison to cable 1. It's unlikely it is down to noise. When comparing 20 individual measurements for each cable show at most 0.3 dB difference. Difference on 2 vs 3 graph are at most 0.8 dB.

nopiano said:
Insider, how do we read the Phase scale at the right hand end of the individual graphs? One seems centred around 180, the other two on 90. Is that relevant?

I think I’m ok with the amplitude vs frequency ones as that’s more familiar.

Well spotted. The graph it comes from is SPL & Phase they both can be view. However Phase is not actually not shown on these graphs as I was worried it would make them harder to read. See box on the bottom isn't ticked. Phase behaviour similarily to Frequency response differs between cables.
 
insider9 said:
nopiano said:
So I conclude that 2 and 3 are nearer to each other then either is to 1. Essentially 2 and 3 are within a dB of each other. With no trends I can detect, by which I mean no slopes or bulges. Just wiggles which might be within the realms of noise?

Indeed, differences 2 vs 3 are smaller than any comparison to cable 1. It's unlikely it is down to noise. When comparing 20 individual measurements for each cable show at most 0.3 dB difference. Difference on 2 vs 3 graph are at most 0.8 dB.

So can we say that 2 and 3 differ by around 0.5dB at most, that being the difference between their intrinsic variation and the comparison test?

BTW, thanks for doing these. I find it very interesting, and just want to avoid drawing any conclusions that don’t really stand scrutiny!
 

insider9

Well-known member
nopiano said:
So can we say that 2 and 3 differ by around 0.5dB at most, that being the difference between their intrinsic variation and the comparison test?

BTW, thanks for doing these. I find it very interesting, and just want to avoid drawing any conclusions that don’t really stand scrutiny!

That's pretty much it. It isn't a huge difference but I don't think anyone expected one. If there was going to be one at all :) I'm glad you find it interesting too.

By the way these are cables used in comparison I purposely didn't name them on graphs as the point of the experiment to see if differences are measurable, not really what the differences were.

A - NYY-J / solid core copper 2.5mm2 / £2.35 per meter (unterminated) link

B - Cambridge Audio Ulta 100 / stranded silver plated copper 2.5mm2 / £4.99 per meter (unterminated) link

C - TQ Silver / details unknown / £96 per meter (terminated) link

I've named them A, B, C above. Fancy guessing which one is CABLE 1, 2, 3 as annotated on the graphs?
 
I’d guess that cable 1 is the Tellurium. Only because it seems to have a slight treble rise for added brilliance. The other two are closer to each other so couldn’t not guess further.

Let others have a go before answering!
 

Native_bon

Well-known member
Nov 26, 2008
181
4
18,595
Visit site
Much appreciated doing these test, only problem is microphones are just stupid instruments to pick up sound with no Computer like our brains to analyse sound from our ears. Also every cable will react differently to Most components connected to them at both ends, ie.. Amp and speaker. Still it's a good effort.
 

insider9

Well-known member
It's the best I could come up with :) I encourage everyone if at all possible to come up with other more accurate methods and maybe this will rub off on manufacturers. We have speakers measurements and specs, maybe it's time effects of cables were better explained than just they're as if "the veil has been lifted."

Access to information is better than ever and there should be no excuses. If we expect these as consumers they will eventually have to provide them. It's only a matter of time before some maufacturer will be selling measurably better cables. Who know it could be my new venture *blum3*
 

Andrewjvt

New member
Jun 18, 2014
99
4
0
Visit site
I encourage everyone if at all possible to come up with other more accurate methods and maybe this will rub off on manufacturers.

Is this a genuine remark or a piss take?
 

andyjm

New member
Jul 20, 2012
15
3
0
Visit site
insider9 said:
I shared this as I always wondered if it's possibly and what's the best way to do it. My previous attempts were flawed.

I understand there may be criticism. One of the reasons why I've looked for input on methodology. If someone can present a better way and show their work I'd be thrilled.

Above measurements show differences exist. Not just that but that different cables measure better/worse at certain frequencies. This goes some way to explain why people can describe cable traits.

If ears are superior to microphone they will pick up on more even differences.

Insider,

In engineering, it is very easy to think you are measuring one thing, and end up measuring something else.

Unless the cables have active components (and they don't), about the only effect you would expect from a cable would be some form of frequency slope - perhaps a tail off in LF for thin cables, a pick up in HF or a hump or dip at some point. The spiky nature of the difference plots means there is something else going on, and I am afraid I wouldn' trust them.
 

ellisdj

New member
Dec 11, 2008
377
1
0
Visit site
Andy you profess to being very knowledgeable and you criticise here.

The "spiky nature" of the measurements is how actual freq resposne measurements look every single time.

That indicates to me you have never measured a speaker or a speaker in a room in which case how can you even comment on what insider has done to criticise it?
 

ellisdj

New member
Dec 11, 2008
377
1
0
Visit site
Insider by the looks of what you have done you have found a spot in the room pretty flat from mid to treble devoid of as many reflections as possible, far from easy.

Then kept the signal volume quite low - or maybe that just the graph axis you have used somehow - I dont know how you would do that.

If anyone has used REW its suggested to run 3 sweeps and take an average - everytime I have run a sweep the result has been identical every single time when you overlay them. I wasnt looking for this fine level of detail but I do know the results you get are repeatable with the software.

I dont think you can use REW to measure an incoming signal such as music. It may work in the same way I am not sure, you might end up with even more fuzz due to the complexity of changing volume of music compared to a sine wave sweep?

What would be an interesting test is measure and record the speaker impulse response for a duration of music that you can hear a big difference when changing cables.

Then overlay that as an event for the same measurement of a different cable - however to the best of my knowledge we only get an impulse response measurement from a sine wave sweep which doesnt represent music content at all, its not supposed to.

To do this properly you would also need an anachoic chamber - you can maybe see why these test are not done - its very hard
 

TRENDING THREADS