QuestForThe13thNote said:
PMC are all about mixing the bass with treble and mid range and achieving a really good balance. Ie meshing the bass with the other elements and coming out well. Also low levels of distortion with the transmission line used in all their speakers. These are the virtues the mags go on about the most and i think it's true too. Im on my second pair. First twenty 23 , now twenty5 23
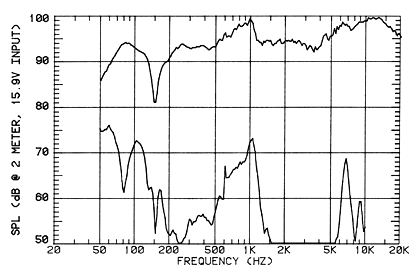
Looking at distortion graphs at SoundStage! for GB1 again I'm not convinced. In fact rather shocked by that one. Close to 4% THD at 1kHz. That's nasty! 9% at 100Hz, dear me...
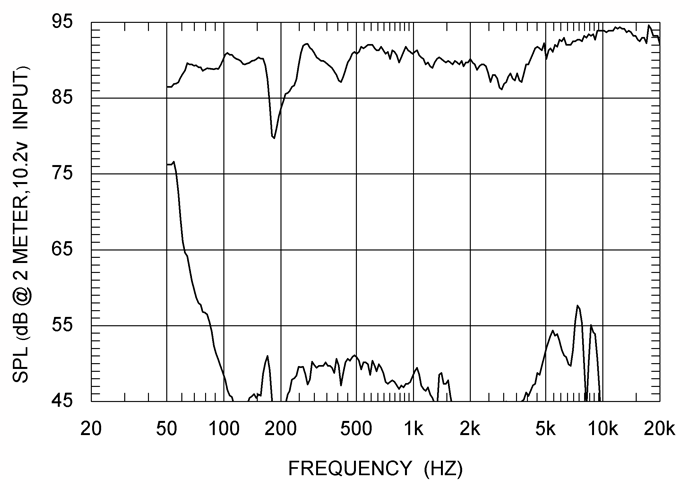
Then again twenty.24
3% THD at around 8kHz...
Have a look compared to my Jamos in room distortion. Be mindful that it was done on the end of an amp which costs circa £50 second hand. So with better electronics it could be even better.
My THD hardly ever goes above 1% from 33Hz all the way up! They're around 2% THD when they start to roll off at 27Hz.
Measurements can be found - here
QuestForThe13thNote said:
If you are going for the speaker you mention, id instead try and listen to a twenty 23 or 24. I'd say this as I've heard many people comment, who have owned older pmc's and then the twenties, that the twenty series is better Some dealers sell them in the graphite finish (but I think you'd have to look hard as almost all have the latest 25 series speaker as demo sets, unsurprising due to price hike between 20 to 25) .
If you can find any twenty series under £500 I would be interested.
QuestForThe13thNote said:
Since I've taken the time to give feedback (and will happily give more) can you explain to me exactly how those graphs are measured, how the plots are joined up, and whether it's possible to predict sound from a plot. I must admit I have limited knowledge of what these are meant to show as I just listen. But how come the spikes etc, do you think. But I must say I'm very dubious at how it's ever possible to predict sound quality from such a graph, but I don't doubt it can help show some things or not e.g. Where bass trails off etc.
Well, I don't intend to write a book about it

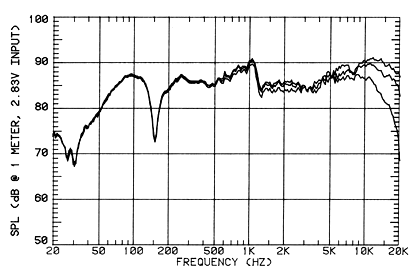
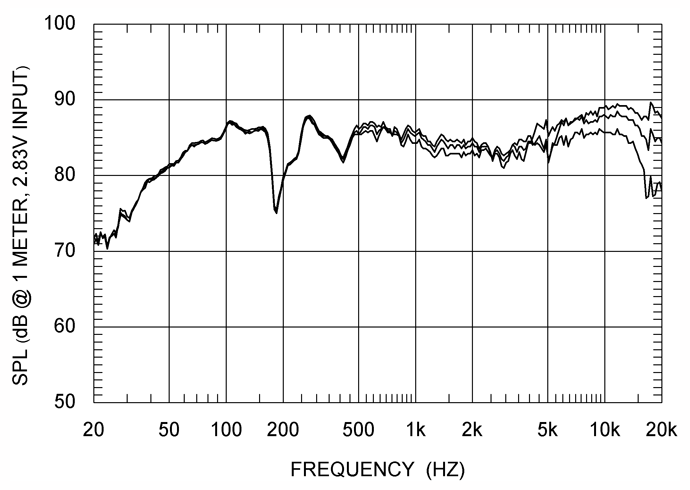
It is a big subject but I'll do my best. Graphs are as described Y axis is SPL (volume if you like) X axis frequency. The plots are not joined up. SoundStage! measurements show 3 measurements (Top curve: on-axis response, Middle curve: 15 degrees off-axis response, Bottom curve: 30 degrees off-axis response).
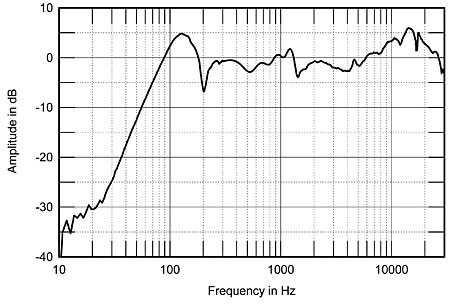
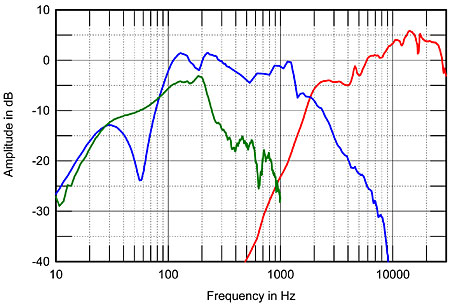
Spikes are very normal and most measuements you see posted on the internet have smoothing applied to them. See the same measurements of my speakers below
No smoothing (posted in #1) - here
1/24 octave smoothing - here
1/6 octave smoothing - here
I don't know what level of smoothing was used for SoundStage! measurements.
Regardless the measurements are taken with a calibrated measurements microphone. Measuring a frequency sweep. My measurements should show massive deficiencies vs theirs as I don't own a anechoic chamber. That's what bother me. On paper my speakers measure better. Would they sound better also I don't know but would rather not spend £500 for a speaker that is less than what I have.
As to if it's possible to predict the sound? It's not only possible to tell certain things about the sound from measurments (depending what you're looking at). You can definitely tell the balance of the speakers (warm, neutral, bright) you can definitely tell issues you might have with a speakers. That especially with GB1 are a plenty.
Looking at the both PMC graphs there's about 10dB difference between 100Hz and 150/180Hz. That's twice as loud. From 150Hz to 100Hz with GB1.
QuestForThe13thNote said:
But If it's about the depth of bass but not about balance, I'm pretty sure that graph won't tell you anything. I stand corrected if I'm wrong though.
Very wrong indeed on this one. Unfortunately
